Financial highlights

Financial
performance

Icon of three rising bars with an upward arrow above them, representing growth or increasing results

Profit attributable to
ordinary shareholders

Rs 20,114 m

+11.3%

Profits attributable to ordinary shareholders - Bar chart in Rs m: Jun 24 is 16,045, Jun 25 is 18,065, and Jun 26 is highest at 20,114.

Total assets

Rs 1,283 bn

+27.4%

Total assets - Bar chart in Rs bn: Jun 24 is 939, Jun 25 is 1,007, and Jun 26 is highest at 1,283.

Shareholder
value

Icon of a diamond on a presentation screen above a row of audience members, suggesting a showcase or premium event

Diluted earnings per share

Rs 76.54

+9.1%

Diluted earnings per share - Bar chart in Rs: Jun 26 is highest at 76.54, Jun 25 is 70.13, and Jun 24 is 63.65, showing a steady daily rise.

Dividend per share

Rs 27.50

+7.8%

Dividend per share - Bar chart of prices in Rs: Jun 24 is 23.00, Jun 25 is 25.50, and Jun 26 is 27.50, the highest and highlighted.

Market
positioning

Pie chart with one slice pulled out and a location pin above it, representing geographic or regional data breakdown

Customer loans

Rs 521 bn

+26.1%

Customer loans - Bar chart in Rs bn: Jun 26 is highest at 521, compared with 413 for Jun 25 and 418 for Jun 24.

Customer deposits

Rs 881 bn

+21.4%

Customer deposits - Bar chart in Rs bn: Jun 24 is 672, Jun 25 is 726, and Jun 26 is highest at 881.

Efficiency and
return ratios

Line icon of a plant with a round bud on top of a stem and two leaves, standing on a ground line

Cost-to-income

38.1%

+75 bps

Cost-to-income - Bar chart of percentages rising each June: 36.7% in 2024, 37.4% in 2025, and 38.1% in 2026 (highlighted).

Return on equity

16.0%

-34 bps

Return on equity - Bar chart in percent: Jun 26 is 16.0 (highlighted), Jun 25 is 16.4, and Jun 24 is 16.6, showing a slight decline.

Asset quality & capitalisation

Open hand holding a money bag, line icon representing giving, funding, or payment

Gross NPL ratio

2.0%

-99 bps

Gross NPL ratio - Bar chart in percent: Jun 24 was 3.1, Jun 25 was 3.0, and Jun 26 is 2.0, highlighted as the lowest.

Capital adequacy ratio

20.3%

-171 bps

Capital adequacy ratio - Bar chart in percent: Jun 24 is 20.5, Jun 25 is 22.0, and Jun 26 is 20.3, the lowest of the three.

Sustainability highlights

Icon of three people, one in front wearing a suit, representing nurturing our people and culture

Nurturing 
our people 
and culture

Workforce

Bar chart of workforce growth: Jun 26 highlighted at about 5,200, Jun 25 at about 4,900, Jun 24 at about 4,400, showing steady growth.

Trust Index

MCB Group accredited Great Place to Work®
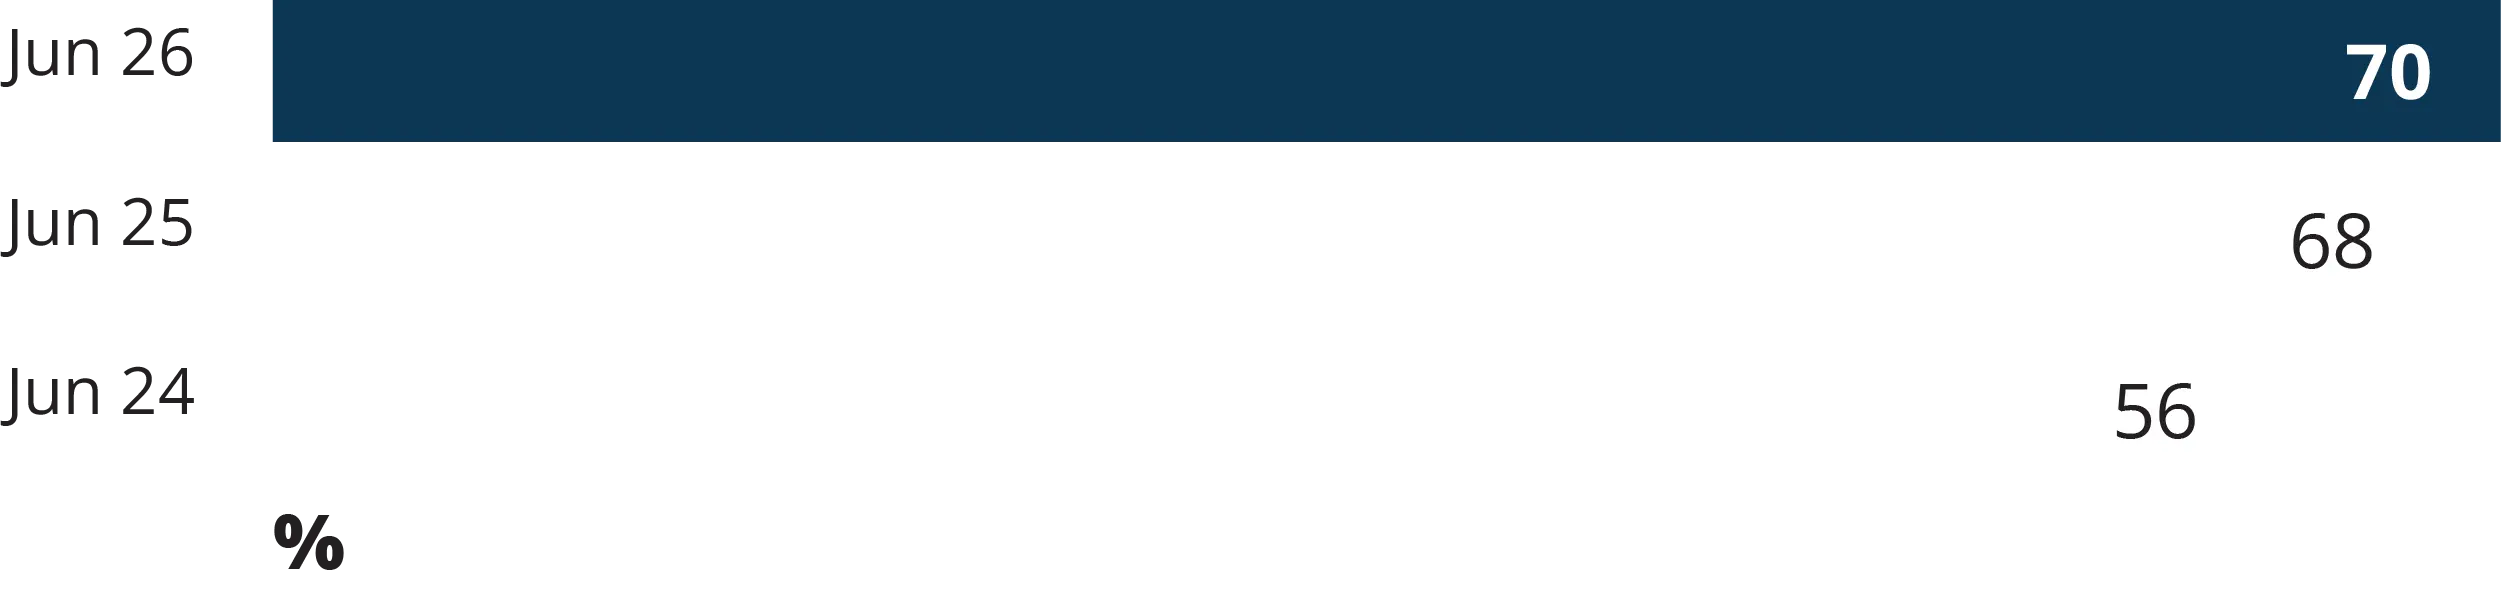
Bar chart of Trust Index percent values: Jun 26 is 70, Jun 25 is 68, Jun 24 is 56, showing a steady rise.

35.1%

Women at middle and senior management level*

Icon of an audience of five people facing a presentation screen showing an upward-trending arrow graph, on a navy circle

Supporting 
clients and 
sustainable 
growth

Overall customer base

Bar chart of overall customer base: about 1,340,200 on Jun 26, 1,287,600 on Jun 25, and 1,243,100 on Jun 24.

Launch of Intra-African
trade envelope*

USD 1 bn

Amount earmarked

Scaling up sustainable
finance envelope*

Rs 25 bn

from Rs 10 bn previously

'Lokal is Beautiful'
loan scheme*

Rs 452.8 m

Amount disbursed

Three people standing above a half globe, symbolising shared prosperity and global community

Creating 
shared 
prosperity

Rs 76.5 m

Amount spent by
MCB Forward Foundation

14.5%

of total corporate tax paid in Mauritius*
(inclusive of levies on income)

~1.5%

of the total value added
generated in Seychelles

~4.5%

of the total value added
generated in Mauritius*

* Relates to MCB Ltd

Note: Figures are as at 30 June 2026, unless otherwise stated
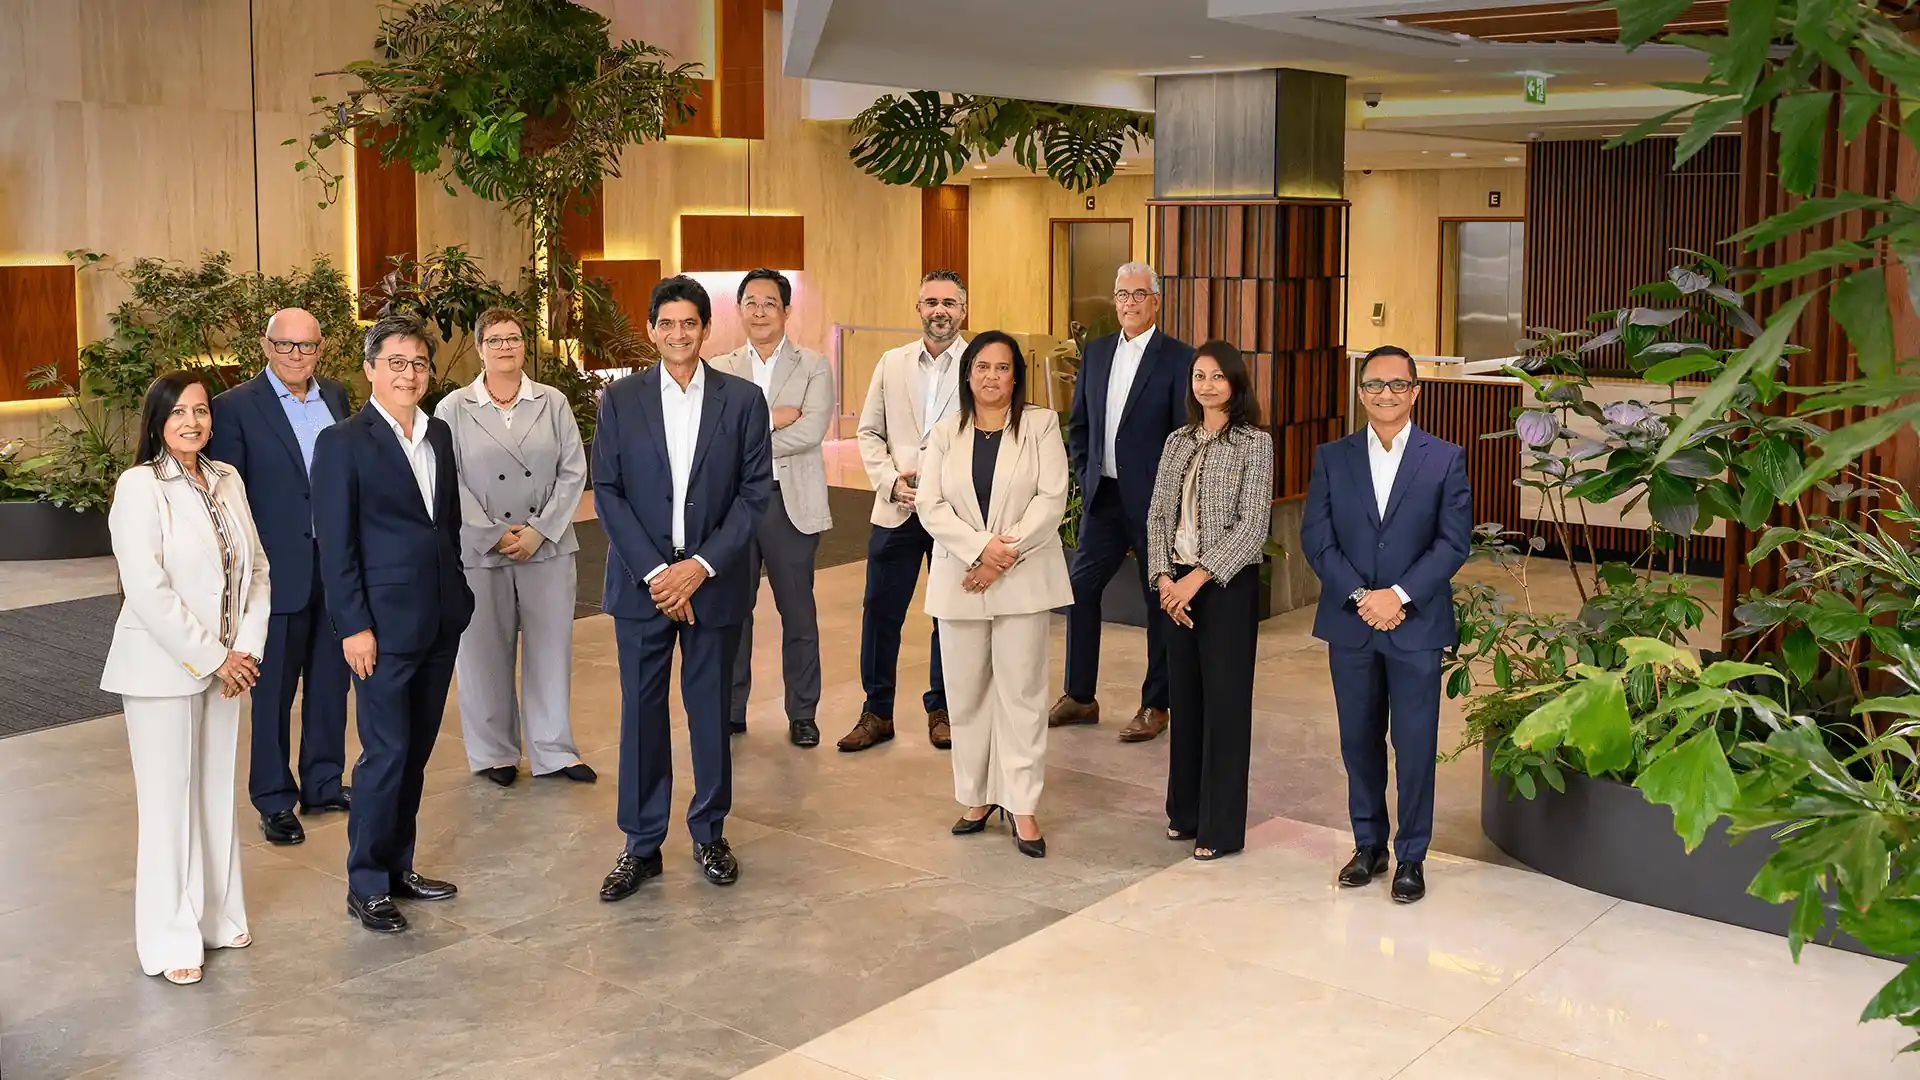
MCB Group directors in formal attire pose together in a modern lobby with wood panels and lush indoor plants.

From left to right:

Maya Makanjee, Stephen Davidson, Jean Michel Ng Tseung, Anna Margaretha Roets, Jayananda Nirsimloo, Georges Michael David Lising, Cédric Jeannot, Marivonne Oxenham (Secretary to the Board), Yvan Legris, San T Singaravelloo and Dipak Chummun

Chairperson's statement

"I remain confident in our strategy, our diversified business model and our capacity to adapt and create long-term value for all stakeholders.”


Jay NIRSIMLOO

Chairperson

Read the full statement

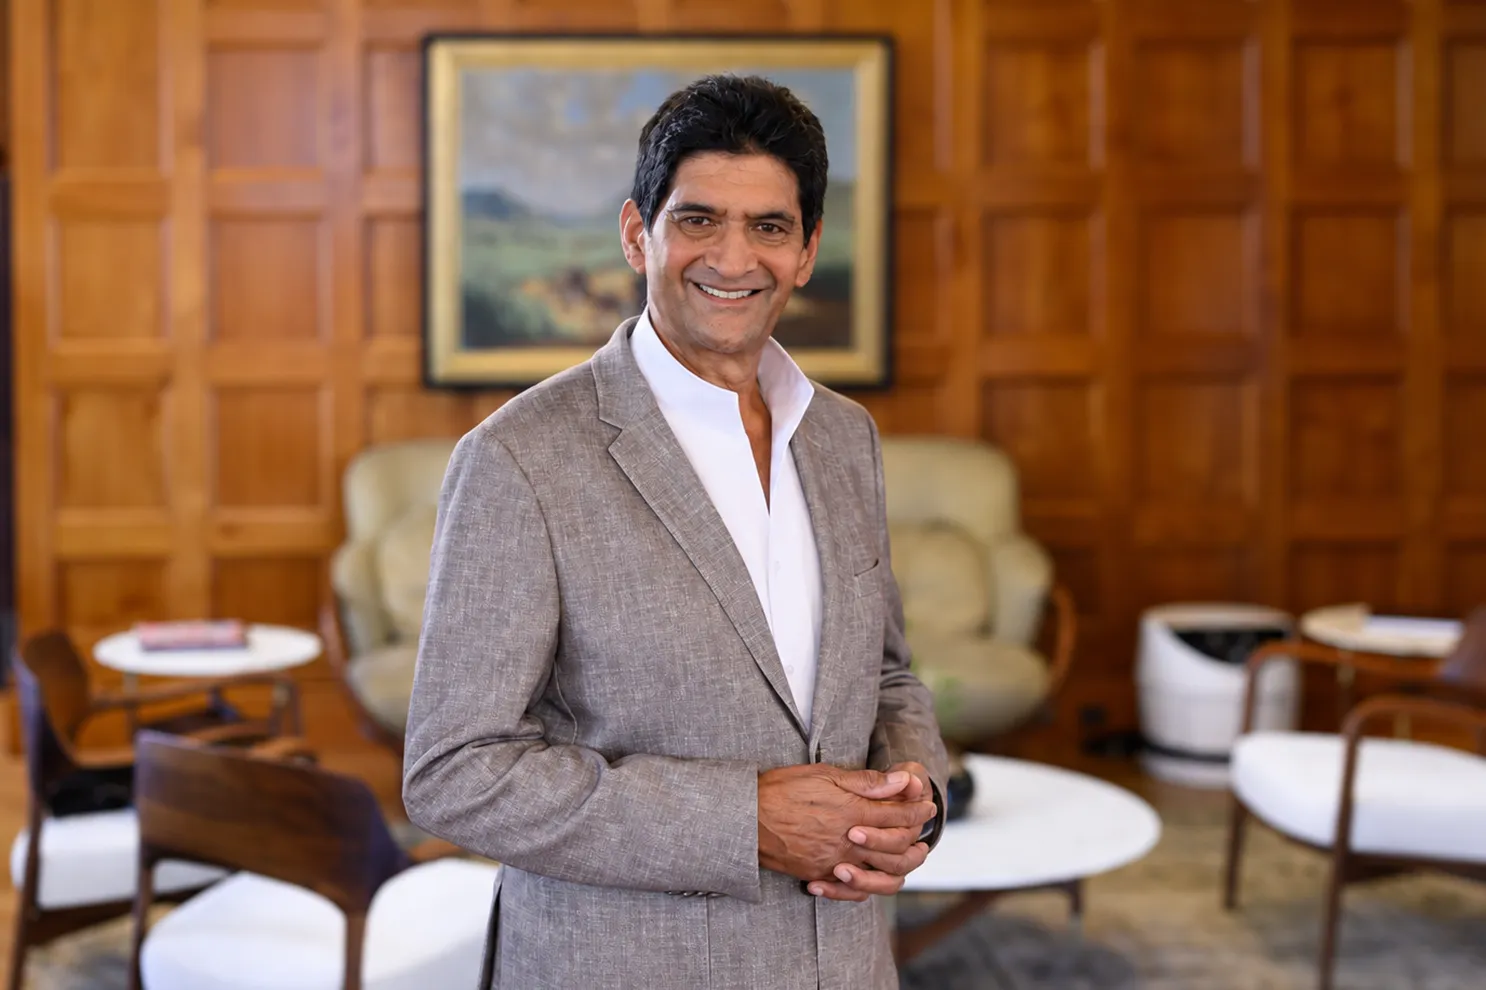
Message from the Group Chief Executive

"One year on from its launch, Vision 2030 is increasingly shaping how decisions are made and executed across the Group."


Jean Michel NG TSEUNG

Group Chief Executive

Read the full statement

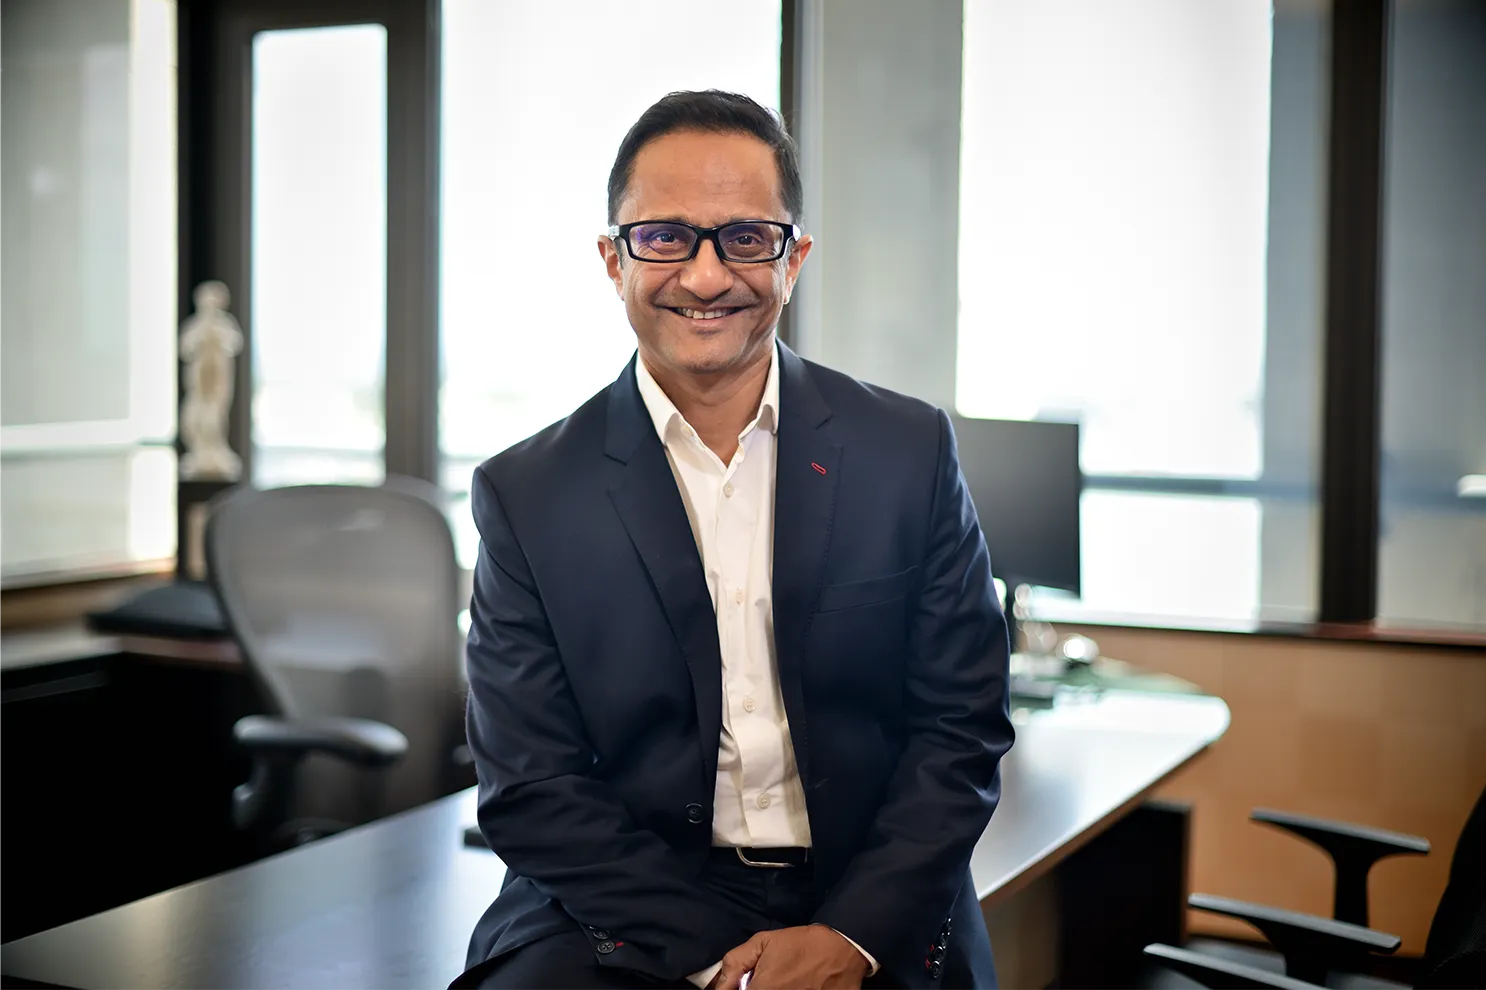
Group Chief Finance Officer Report

"Our resilient and diversified business model enabled the Group to deliver a strong performance during the financial year ended 30 June 2026."


Dipak CHUMMUN

Group Chief Finance Officer

View the report

The Board

Key

Blue circle with text AC stands for Audit Committee

Audit Committee


Orange circle with text CSC stands for Corporate Strategy Committee

Corporate Strategy Committee

Green circle with text CTRC stands for Cyber and Technology Risk Committee

Cyber and Technology Risk Committee

Purple circle with text CGSC stands for Corporate Governance and Sustainability Committee
Corporate Governance and Sustainability Committee

Yellow circle with text RMC stands for Audit Committee

Risk Monitoring Committee


Dark gray circle with text SMC stands for Supervisory and Monitoring Committee

Supervisory and Monitoring Committee

Green letter C stands for Committee Chair

Committee Chair


Green letter M stands for Committee Member

Committee Member

Headshot of Jayananda Nirsimloo, Chairperson, Independent Non-Executive Director, in black-and-white

Jayananda NIRSIMLOO

Chairperson,Independent Non-Executive Director

Purple circle with text CGSC stands for Corporate Governance and Sustainability Committee
Green letter C stands for Committee Chair
Orange circle with text CSC stands for Corporate Strategy Committee
Green letter C stands for Committee Chair
Yellow circle with text RMC stands for Audit Committee
Green letter M stands for Committee Member
Dark gray circle with text SMC stands for Supervisory and Monitoring Committee
Green letter C stands for Committee Chair
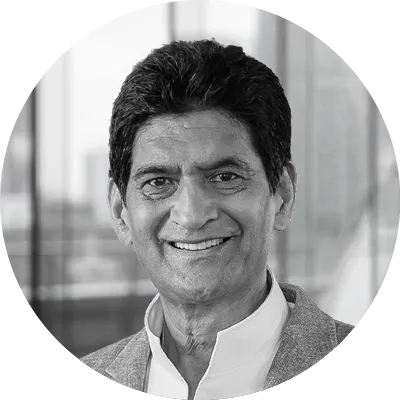
Headshot of Jean Michel Ng Tseung, Group Chief Executive and Executive Director, in black-and-white

Jean Michel NG TSEUNG

Group Chief Executive and
Executive Director

Purple circle with text CGSC stands for Corporate Governance and Sustainability Committee
Green letter M stands for Committee Member
Orange circle with text CSC stands for Corporate Strategy Committee
Green letter M stands for Committee Member
Green circle with text CTRC stands for Cyber and Technology Risk Committee
Green letter M stands for Committee Member
Yellow circle with text RMC stands for Audit Committee
Green letter M stands for Committee Member
Dark gray circle with text SMC stands for Supervisory and Monitoring Committee
Green letter M stands for Committee Member
Headshot of Dipak Chummun, Group Chief Finance Officer and Executive Director, in black-and-white

Dipak CHUMMUN

Group Chief Finance Officer and
Executive Director

Orange circle with text CSC stands for Corporate Strategy Committee
Green letter M stands for Committee Member
Yellow circle with text RMC stands for Audit Committee
Green letter M stands for Committee Member
Dark gray circle with text SMC stands for Supervisory and Monitoring Committee
Green letter M stands for Committee Member
Headshot of Stephen Davidson, Independent Non-Executive Director, in black-and-white

Stephen DAVIDSON

Independent Non-Executive Director

Purple circle with text CGSC stands for Corporate Governance and Sustainability Committee
Green letter M stands for Committee Member
Green circle with text CTRC stands for Cyber and Technology Risk Committee
Green letter M stands for Committee Member
Yellow circle with text RMC stands for Audit Committee
Green letter C stands for Committee Chair
Headshot of Cédric Jeannot, Independent Non-Executive Director, in black-and-white

Cédric Jeannot

Independent Non-Executive Director

Orange circle with text CSC stands for Corporate Strategy Committee
Green letter M stands for Committee Member
Green circle with text CTRC stands for Cyber and Technology Risk Committee
Green letter C stands for Committee Chair
Headshot of Yvan Legris, Non-Executive Director, in black-and-white

Yvan LEGRIS

Non-Executive Director

Purple circle with text CGSC stands for Corporate Governance and Sustainability Committee
Green letter M stands for Committee Member
Yellow circle with text RMC stands for Audit Committee
Green letter M stands for Committee Member
Headshot of Georges Michael David Lising, Independent Non-Executive Director, in black-and-white

Georges Michael David LISING

Independent Non-Executive Director

Blue circle with text AC stands for Audit Committee
Green letter M stands for Committee Member
Headshot of Maya Makanjee, Independent Non-Executive Director, in black-and-white

Maya MAKANJEE

Independent Non-Executive Director

Orange circle with text CSC stands for Corporate Strategy Committee
Green letter M stands for Committee Member
Purple circle with text CGSC stands for Corporate Governance and Sustainability Committee
Green letter M stands for Committee Member
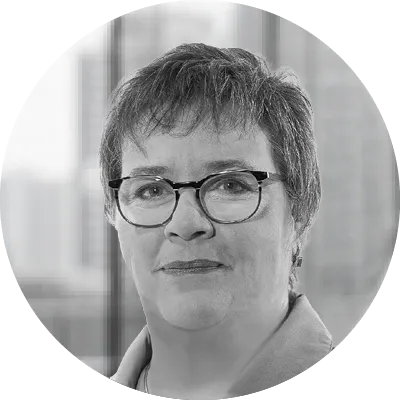
Headshot of Anna Margaretha (Marna) Roets, Independent Non-Executive Director, in black-and-white

Anna Margaretha (Marna) ROETS

Independent Non-Executive Director

Blue circle with text AC stands for Audit Committee
Green letter M stands for Committee Member
Headshot of San T Singaravelloo, Independent Non-Executive Director, in black-and-white

San T SINGARAVELLOO

Independent Non-Executive Director

Blue circle with text AC stands for Audit Committee
Green letter C stands for Committee Chair
Green circle with text CTRC stands for Cyber and Technology Risk Committee
Green letter M stands for Committee Member

Who we are

With a legacy spanning 188 years, MCB Group has grown into a reputable regional banking and financial services provider. It serves individuals, businesses and institutions across its home markets, Africa and beyond, combining deep expertise with innovation to support sustainable growth and long-term value creation.

Presence in

11 countries

Wide network of correspondent banks across Africa

~100

Banking subsidiaries of the Group
Representative/Advisory Offices of the Bank (Regional hubs)
Group associate (Banque Française Commerciale Ocean Indien)

Our channels

60

Branches/Kiosks

219

ATMs

>770,000

MCB Juice subscribers

Credit and ESG ratings

Moody's Ratings
Deposit ratings

Baa3/P-3
(Negative)

Relates to MCB Ltd

Care Rating (Africa) Private Limited
Issuer ratings

AAA
(Stable)

Pertains to the servicing of financial obligations in Mauritius


Constituent of the SEM Sustainability Index and awarded a 'BBB' MSCI ESG rating

Note: As from November 2026, MCB Group has been awarded an 'AA' MSCI ESG rating

Domestic market shares
(MCB Ltd)

Stock profile

Market capitalisation

~ Rs 113 billion

~ 38% of SEMDEX1

~24,500

Ordinary shareholders
(Individual shareholders account for 45.3% of the ownership base)

~1,870

Preference shareholders
and bondholders

Figures are as at 30 June 2026

1excludes foreign currency denominated, GBL and international companies

Note: The use by MCB Group of any MSCI ESG research LLC or its affiliates (“MSCI”) data, and the use of MSCI logos, trademarks, service marks or index names herein, do not constitute a sponsorship, endorsement, recommendation, or promotion of MCB Group by MSCI. MSCI services and data are the property of MSCI or its information providers, and are provided 'as-is' and without warranty. MSCI names and logos are trademarks or service marks of MSCI.

Who we are

MCB Group is a reputable and prominent regional banking and financial services provider, offering a comprehensive range of tailored and innovative solutions through its local and foreign subsidiaries and associates.

Credit ratings

Moody's Ratings

Deposit ratings


Baa3/P-3
(Negative)


Relates to MCB Ltd

Care Ratings (Africa) Private Limited

Issuer rating


AAA
(Stable)


Pertains to the servicing of financial obligations in Mauritius

Sustainability highlights

Constituent of SEM Sustainability Index and awarded an ‘A’ MSCI ESG rating

Our channels

63

Branches/kiosks

217

ATMs

708,671

MCB Juice subscribers

Presence in

11 countries

Wide network of correspondent banks

~100 in Africa

Domestic market shares of our main subsidiary, MCB Ltd

Domestic market shares of our main subsidiary, MCB Ltd

Domestic credit to the economy

Local currency deposit

Stock profile

Market capitalisation

~ Rs 112 billion

~ 36% of SEMDEX1


~ 24,000

Ordinary shareholders (Individual shareholders account for 46.2% of the ownership base)

~ 1,900

Preference shareholders & bondholders

Our corporate profile

Our value-creating business model

Our value creation model illustrates how we deploy our resources and expertise to generate long-term value for our stakeholders. By aligning our activities with our strategic priorities and responding to operating context influences, we deliver both financial returns and broader non-financial benefits to stakeholders, while safeguarding against value erosion.

Our inputs and resources

Financial capital

The access to capital and funding from investors and depositors that underpin our operations and activities.

Social and relationship capital

The trusted relationships built with customers, business partners and communities to deliver on our strategy and purpose.

Human capital

Our people's technical skills, competencies and their collective knowledge and motivation to innovate and develop customised solutions for our clients.

Natural capital

The use of natural resources and impact we have on the environment through our operations and the products and services we offer to our clients.

Intellectual capital

Our intangible assets, including brand, franchise, corporate culture, intrinsic knowledge and innovation spirit that enable us to offer competitive and relevant financial solutions.

Manufactured capital

The physical branch network, complemented by our modern digital assets that support the efficient conduct of operations and underpin our ability to create value.

Our strategy

Vision 2030

Line icon of a pocket compass with a four-pointed star and arrows marking north, south, east and west.

Lead in our Home Markets

Line-drawn desk globe on a stand, turned to show the continent of Africa, with Madagascar visible to the southeast.

Build a top-tier African Corporate and Investment Bank and Private Banking Institution

Two people raise their arms toward a large trophy with a star between them, symbolising teamwork and shared success.

Win in the workplace

Our value-adding activities

Line icon of a dollar coin atop a coin stack beside a rising bar chart with an upward arrow.

Finance growth

Adapted financing solutions including bank loans, leasing, factoring and microfinance

Line drawing of a treasure chest with a domed lid and a keyhole lock plate on the front.

Promote savings and investment

Deposits and investment related products and services

Open hand holding a glowing light bulb.

Provide business advisory and support

Corporate finance advisory and structured solutions

Line icon of a cardboard box with a circled right arrow.

Enable trade and transactions

Domestic and international payments, cash management and trade finance solutions

Globe icon with latitude and longitude lines and a right-pointing arrow.

Facilitate access to financial markets

Foreign exchange, derivatives and risk hedging instruments

Document icon with an upward trending line graph and two text lines.

Grow
wealth

Asset management, private wealth and custody services

Light gray line icon of a briefcase with a top handle and two front clasps.

Expand value beyond banking and finance

Selected services in non-financial field

Light gray line icon of three people, one centered in front, with a curved line beneath them.

Give back

Community investment, social impact and sustainability initiatives

Material matters

Operating context
influences

Material
sustainability topics
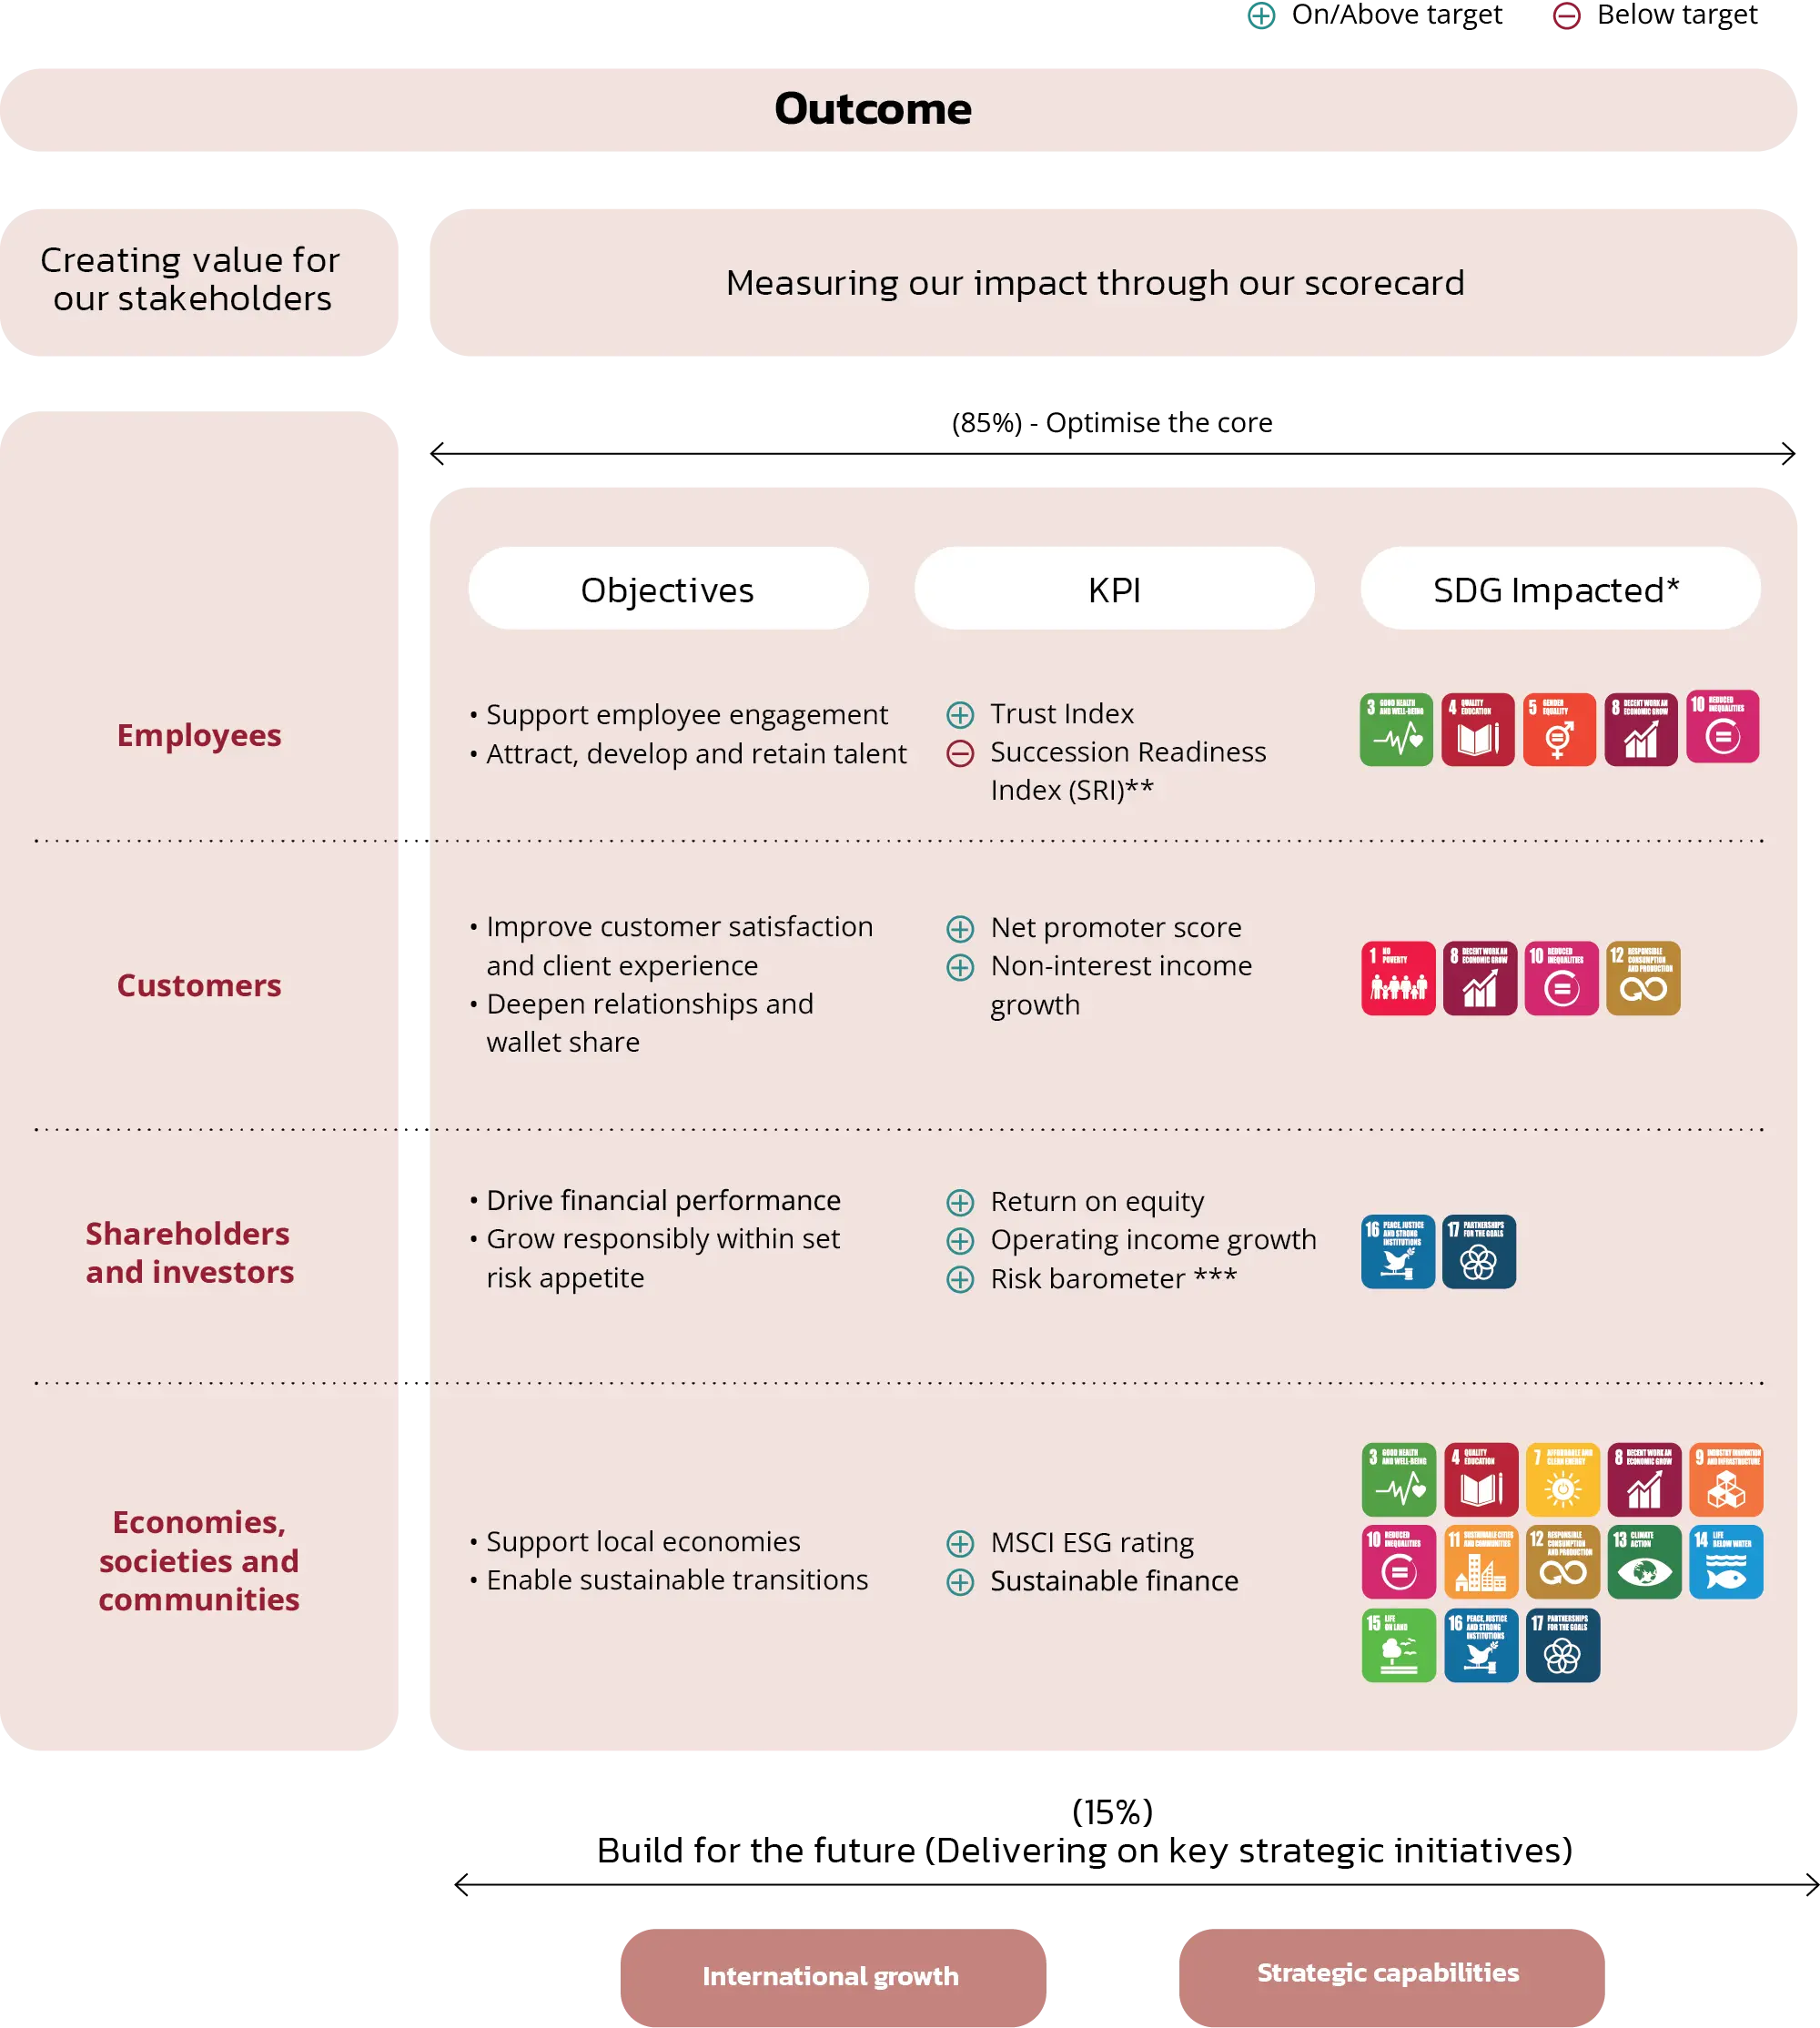
Scorecard linking four stakeholder groups to objectives, KPIs and UN SDGs; 85% optimise the core, 15% build for the future.

The Group Scorecard captures key indicators of strategic progress and performance. However, these metrics should be considered alongside the broader initiatives and outcomes that contribute to sustainable value creation across all stakeholder groups.


Notes:

*

Relevant SDGs indicate areas of broad alignment between our strategic objectives and the Sustainable Development Goals. They do not represent a quantified assessment of MCB Group's contribution to, or impact on, supporting SDG targets.

**

The SRI measures talent pipeline strength, as defined by the percentage of critical leadership roles that have at least two identified internal successors assessed as ready to assume the role within the next 12 to 24 months.

***

Risk barometer is derived from a composite index that integrates compliance, financial and non-financial risks.
Executing Vision 2030

In June 2025, we launched Vision 2030, our strategic roadmap for the years ahead. Over the course of FY 2025/26, we made meaningful progress in translating this ambition into action, while navigating an increasingly dynamic operating environment. Vision 2030 is anchored on three pillars:
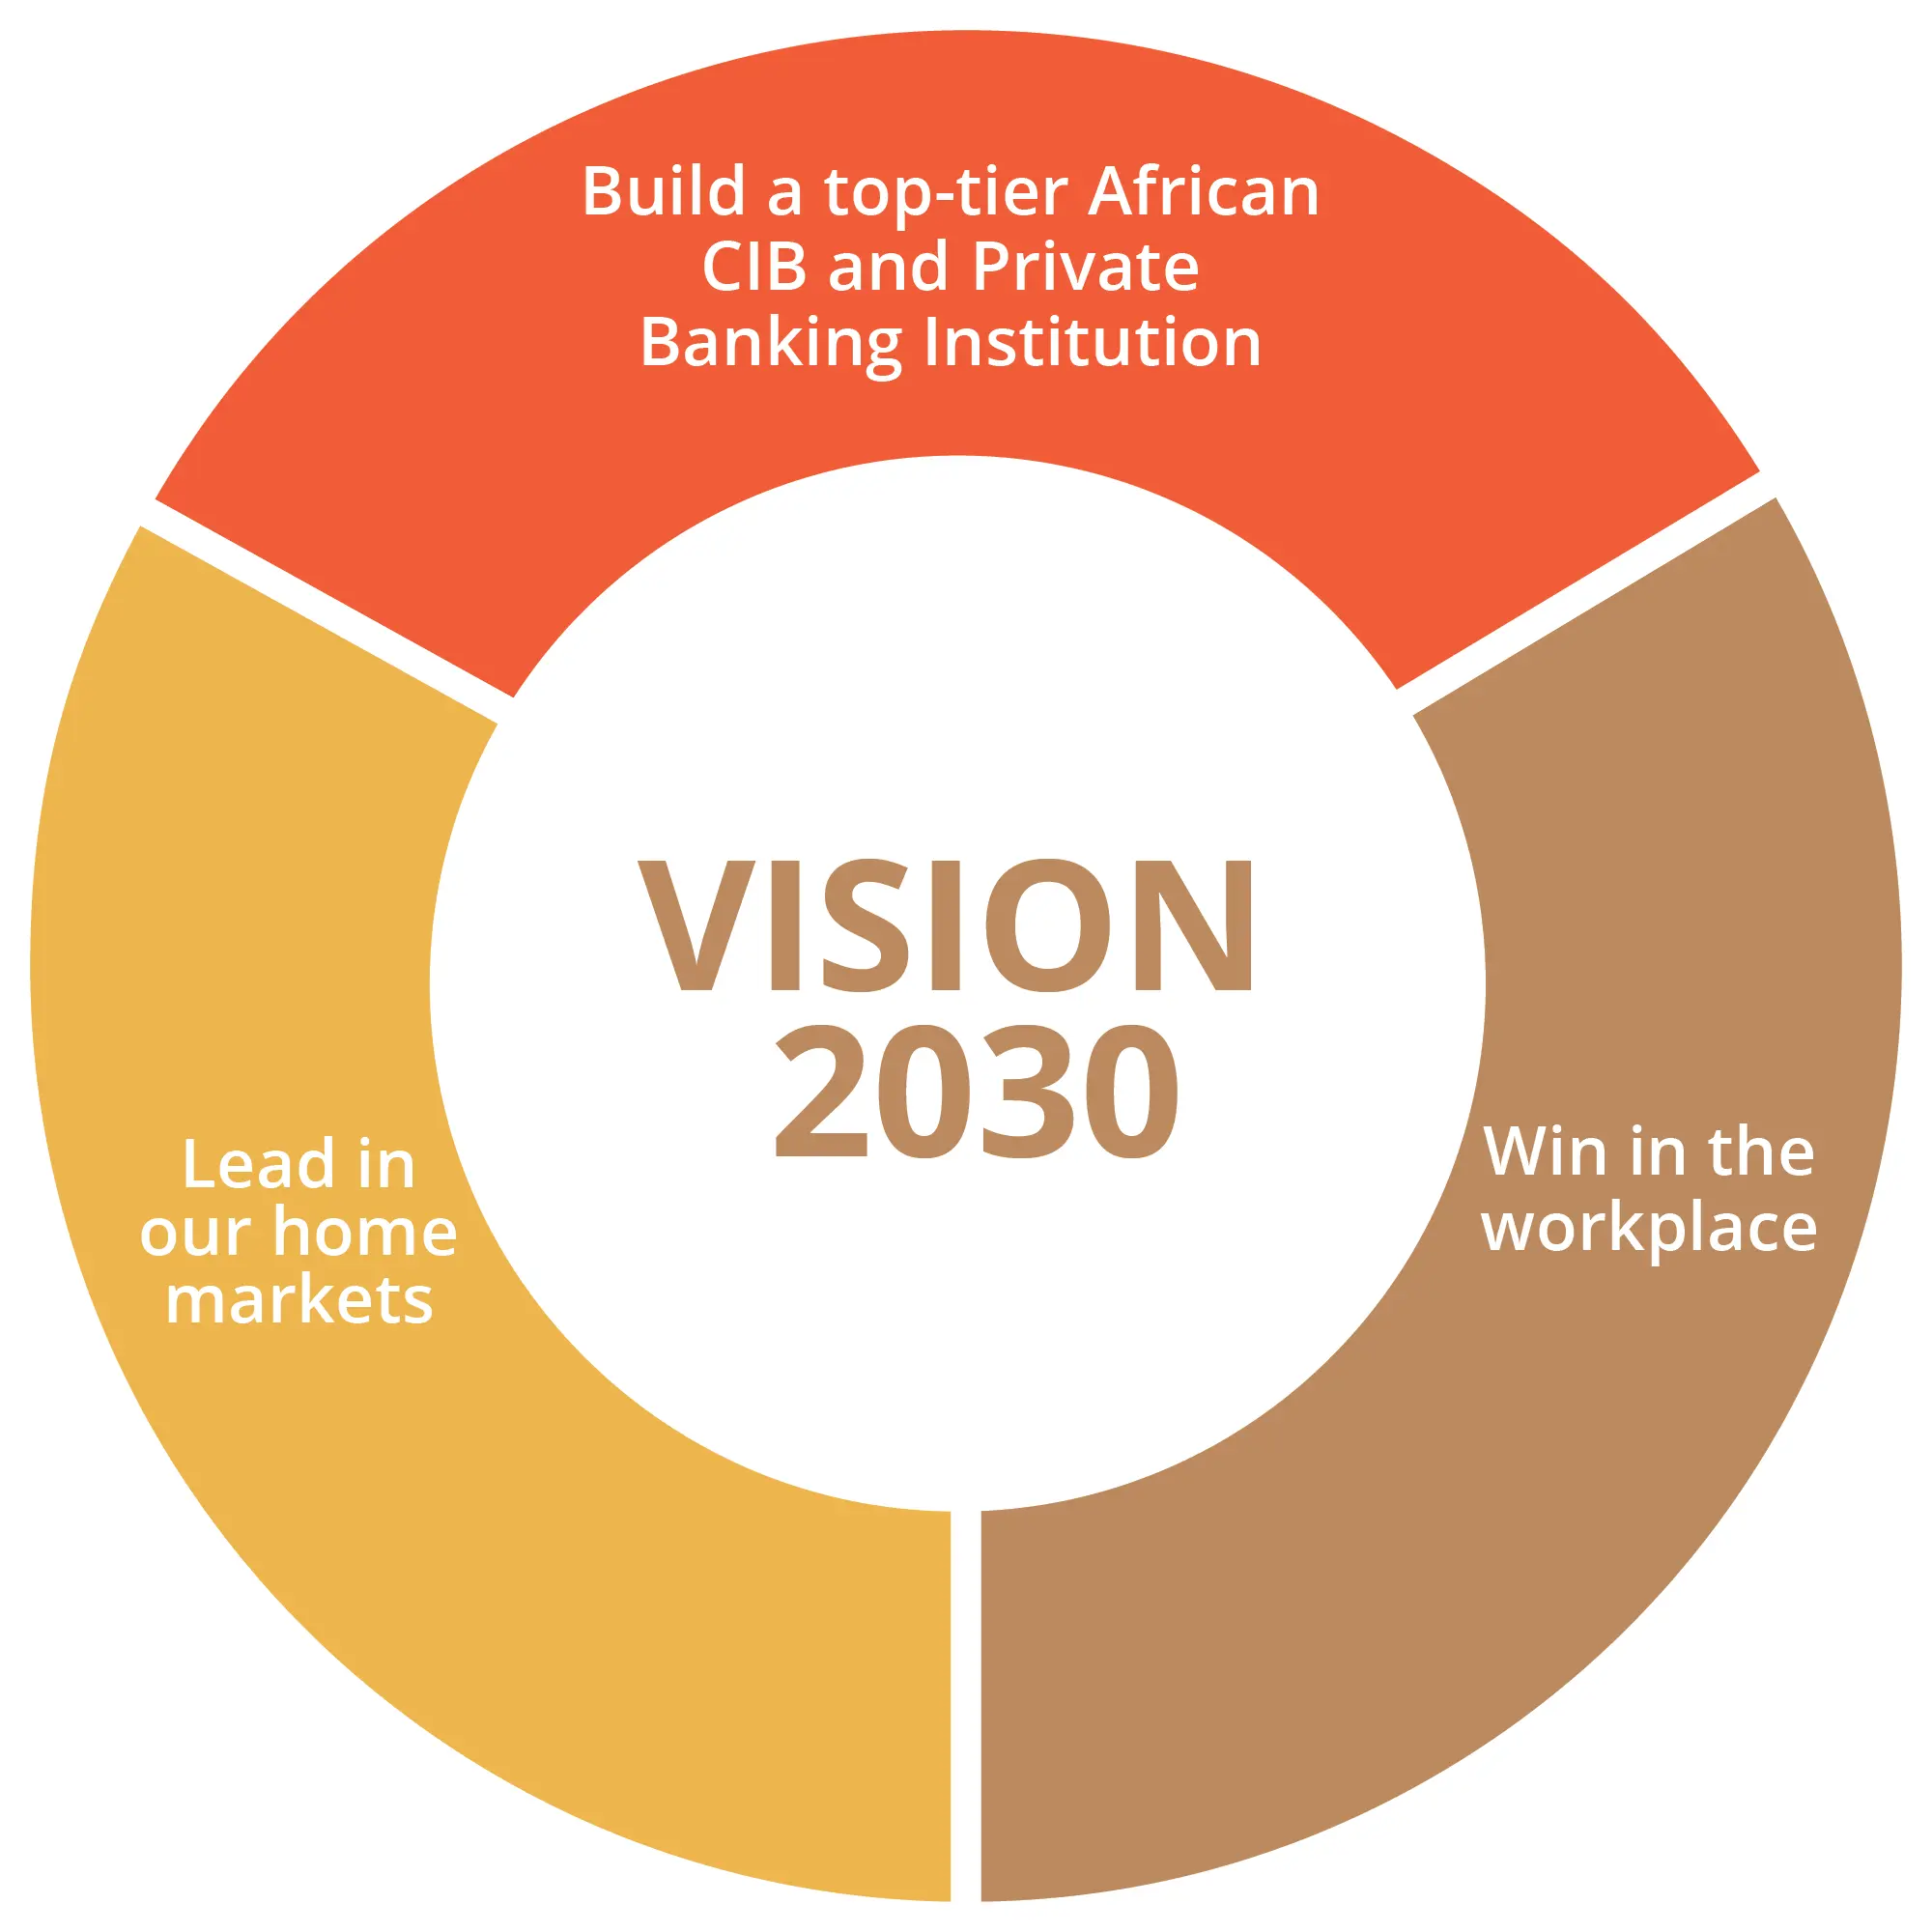

  • Leading across our home markets of Mauritius, Madagascar, Seychelles and Maldives, by enhancing customer experience, anticipating our customers' evolving financial aspirations and empowering them to achieve their ambitions, and contributing to socio-economic development of our home markets;
  • Building a top-tier African Corporate and Investment Bank and Private Banking franchise that facilitates trade and investment flows, supports clients' growth ambitions and advances the continent's transition towards a more sustainable future; and
  • Creating a winning workplace that empowers our people, nurtures innovation and fosters a culture of excellence. In so doing, we seek to deliver lasting value for all our stakeholders.
Vision 2030: goals to build a top-tier African CIB and Private Banking institution, lead home markets, win in the workplace.

Embedding sustainability

Sustainability plays a key role across our strategic pillars, reflecting our commitment to strengthen local and regional economies, protect our culture and environment and improve well-being across our communities.

Elevating customer experience

Customer experience is a key priority for the Group, and we are committed to continuously enhancing the experience we deliver, underpinned by a culture of service excellence and by ongoing investments in digital capabilities.
Approach and principles

The Board of MCB Group Ltd remains steadfast in its commitment to the highest standards of corporate governance as a foundation of the Group's long-term sustainability, resilience and value creation. The Board provides purpose-driven and ethical leadership, sets the tone from the top and oversees the management of MCB Group. The Board believes that good governance reinforces the Group's values and culture by promoting accountability, transparency, effective risk oversight, sound decision making, responsible stakeholder engagement and sustainable business practices across the organisation.

During the financial year, the Board continued to monitor, review and adapt its governance frameworks and practices in response to an increasingly dynamic and complex operating environment. Particular attention was given to developments relevant to the financial services industry, including geopolitical shocks, evolving regulatory landscape, technological change, cybersecurity, artificial intelligence, ESG considerations, evolving workplace dynamics and customer experience in an increasingly competitive landscape. The Board has also maintained a strong focus on ensuring that the Group's strategic orientation and key initiatives remain aligned with its Vision 2030 aspirations, thereby supporting the delivery of sustainable long-term value. Directors participated in ongoing training to stay abreast of emerging issues and strengthen their oversight capabilities, in line with the Group's commitment to sound corporate governance. The Group's Corporate Governance Framework is anchored on the four pillars highlighted hereunder.




Strong commitment to ethics and values


  • Dedicated Board committee overseeing ethical conduct and sustainability matters across the Group
  • Application of the Group's 'Code of Ethics and Business Conduct', approved and monitored by the Board
  • Whistleblowing Policy allowing all employees and other stakeholders to report matters of concern in strict confidentiality
  • Establishment of a Gender Equality Charter


Strict compliance to rules and regulations


  • Adherence by Group entities to the provisions of legislations, rules and regulations in countries where they operate
  • Compliance with the National Code of Corporate Governance for Mauritius (2016)
  • Compliance with international reporting standards as applicable
  • Adoption of the underlying Basel principles by banking subsidiaries


Robust risk governance and internal control


  • Ring-fencing of activities, as gauged by the segregation of banking and non-banking operations
  • Board responsible for the oversight and monitoring of risk profile against risk appetite
  • Strong and transparent governance framework, based on the 'three lines of defence' model
  • Provision of independent assurance by both internal and external auditors


Continuous multi-stakeholder engagement


  • Ongoing dialogue with the investment community, regulatory bodies and authorities
  • Contribution to economic development and resilience by providing adapted financial solutions and support to our customers
  • Safeguard of cultural and environmental heritage
  • Promotion of community well-being and fostering of staff development and welfare

FY 2025/26 highlights

The year in review from a risk perspective

Overall, the Group's risk profile remained within set appetite during FY 2025/26 despite heightened geopolitical, macroeconomic, technological and regulatory uncertainty. Asset quality improved, funding and liquidity remained robust, and capital levels continued to support the Group's growth ambitions. During the year, we strengthened Group-wide oversight, enhanced country, climate, cyber and artificial intelligence risk capabilities, and reinforced forward-looking stress testing. We updated our Enterprise Risk Heat Map to reflect the unfolding risk landscape and strengthened the monitoring framework for our risk mitigation action plans. We also deepened our risk culture across the organisation through awareness sessions, simulated phishing exercises and induction programmes. Strong risk management is a differentiating capability for the Group, enabling us to pursue targeted growth opportunities across our home markets and Africa while maintaining asset quality, capital resilience and stakeholder confidence. By embedding consistent risk standards across our footprint, we support the disciplined and sustainable execution of Vision 2030.

The most prominent external influences impacting our risk landscape in FY 2025/26 related to geopolitical shocks and macroeconomic conditions; evolving regulatory and compliance landscape; technology, AI and cybersecurity threats; climate, environmental and social considerations; workplace transformation and employee engagement; and customer experience in a competitive landscape. A description of these factors and our responses are provided on pages 38 to 44. The key risks set out below represent the most significant risks affecting our business and are not intended to be exhaustive.

Our key risks

Principal financial risks


1. Credit risk


2. Country risk


3. Market risk


4. Asset and liability management risk


5. Capital risk

Principal non-financial risks


6. Model risk


7. Operational risk


8. Business continuity risk


9. Cyber and Information security risk


10. Legal risk


11. Compliance risk


12. Strategic and business risk


13. Reputation risk

Sustainability risks


14. Climate risk


15. Environmental and social risk

Downloads

Full Annual Report 2026

Our corporate profile

Value creation for our stakeholders

Delivering on our strategic objectives

Group Chief Finance Officer report

Corporate governance report

Risk and capital management report

Financial statements

Administrative information

Subscribe to our Email Alerts

Stay up-to-date with our latest releases delivered straight to your inbox.

Contact

Don't hesitate to contact us for additional info

This site is protected by reCAPTCHA and the Google Privacy Policy and Terms of Service apply.

Email alerts

Keep abreast of our financial updates.